Study figure and data
Retinol: fine-wrinkle scores
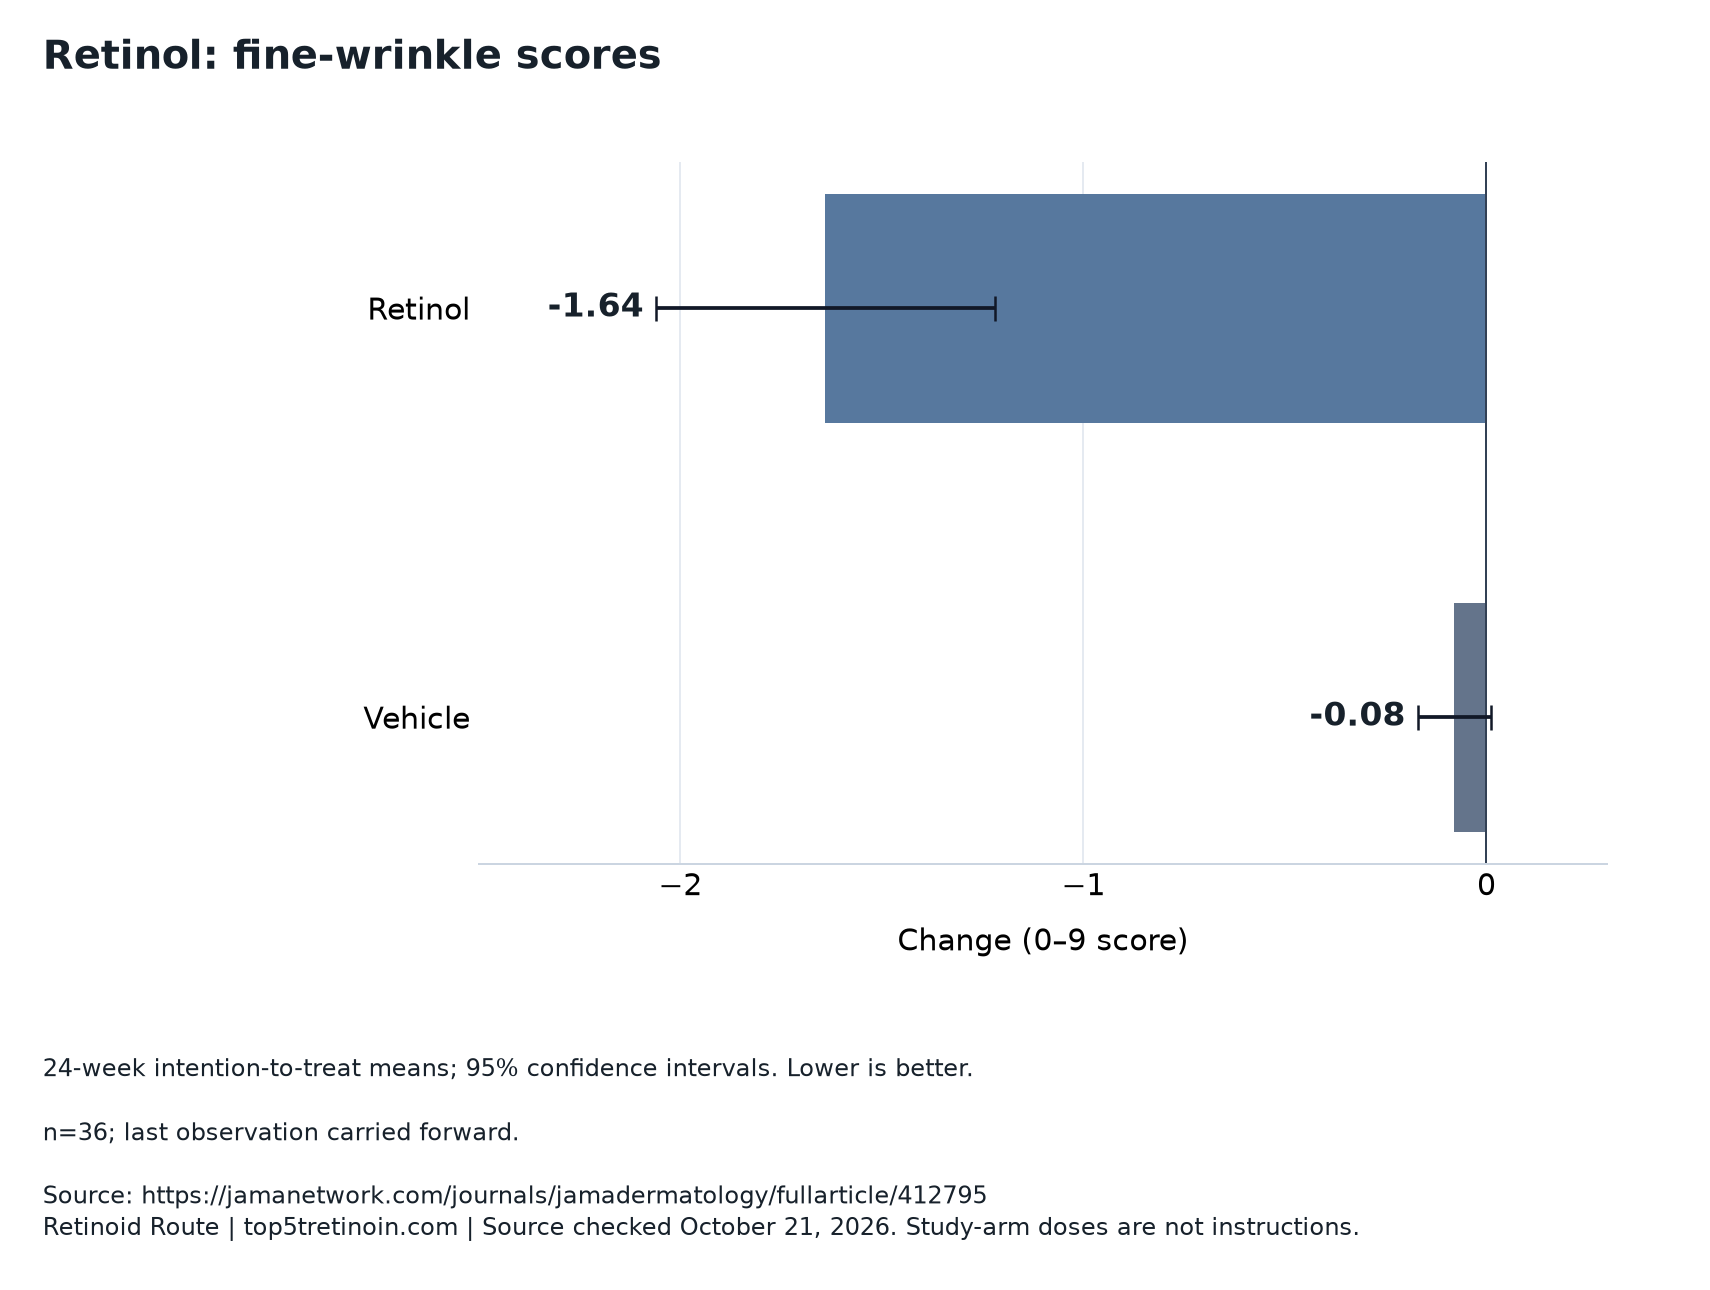
24-week intention-to-treat means; 95% confidence intervals. Lower is better.
n=36; last observation carried forward.
Download chart (PNG)Download data (CSV)Download vector chart (SVG)
| Study arm | Reported value | 95% confidence interval |
|---|---|---|
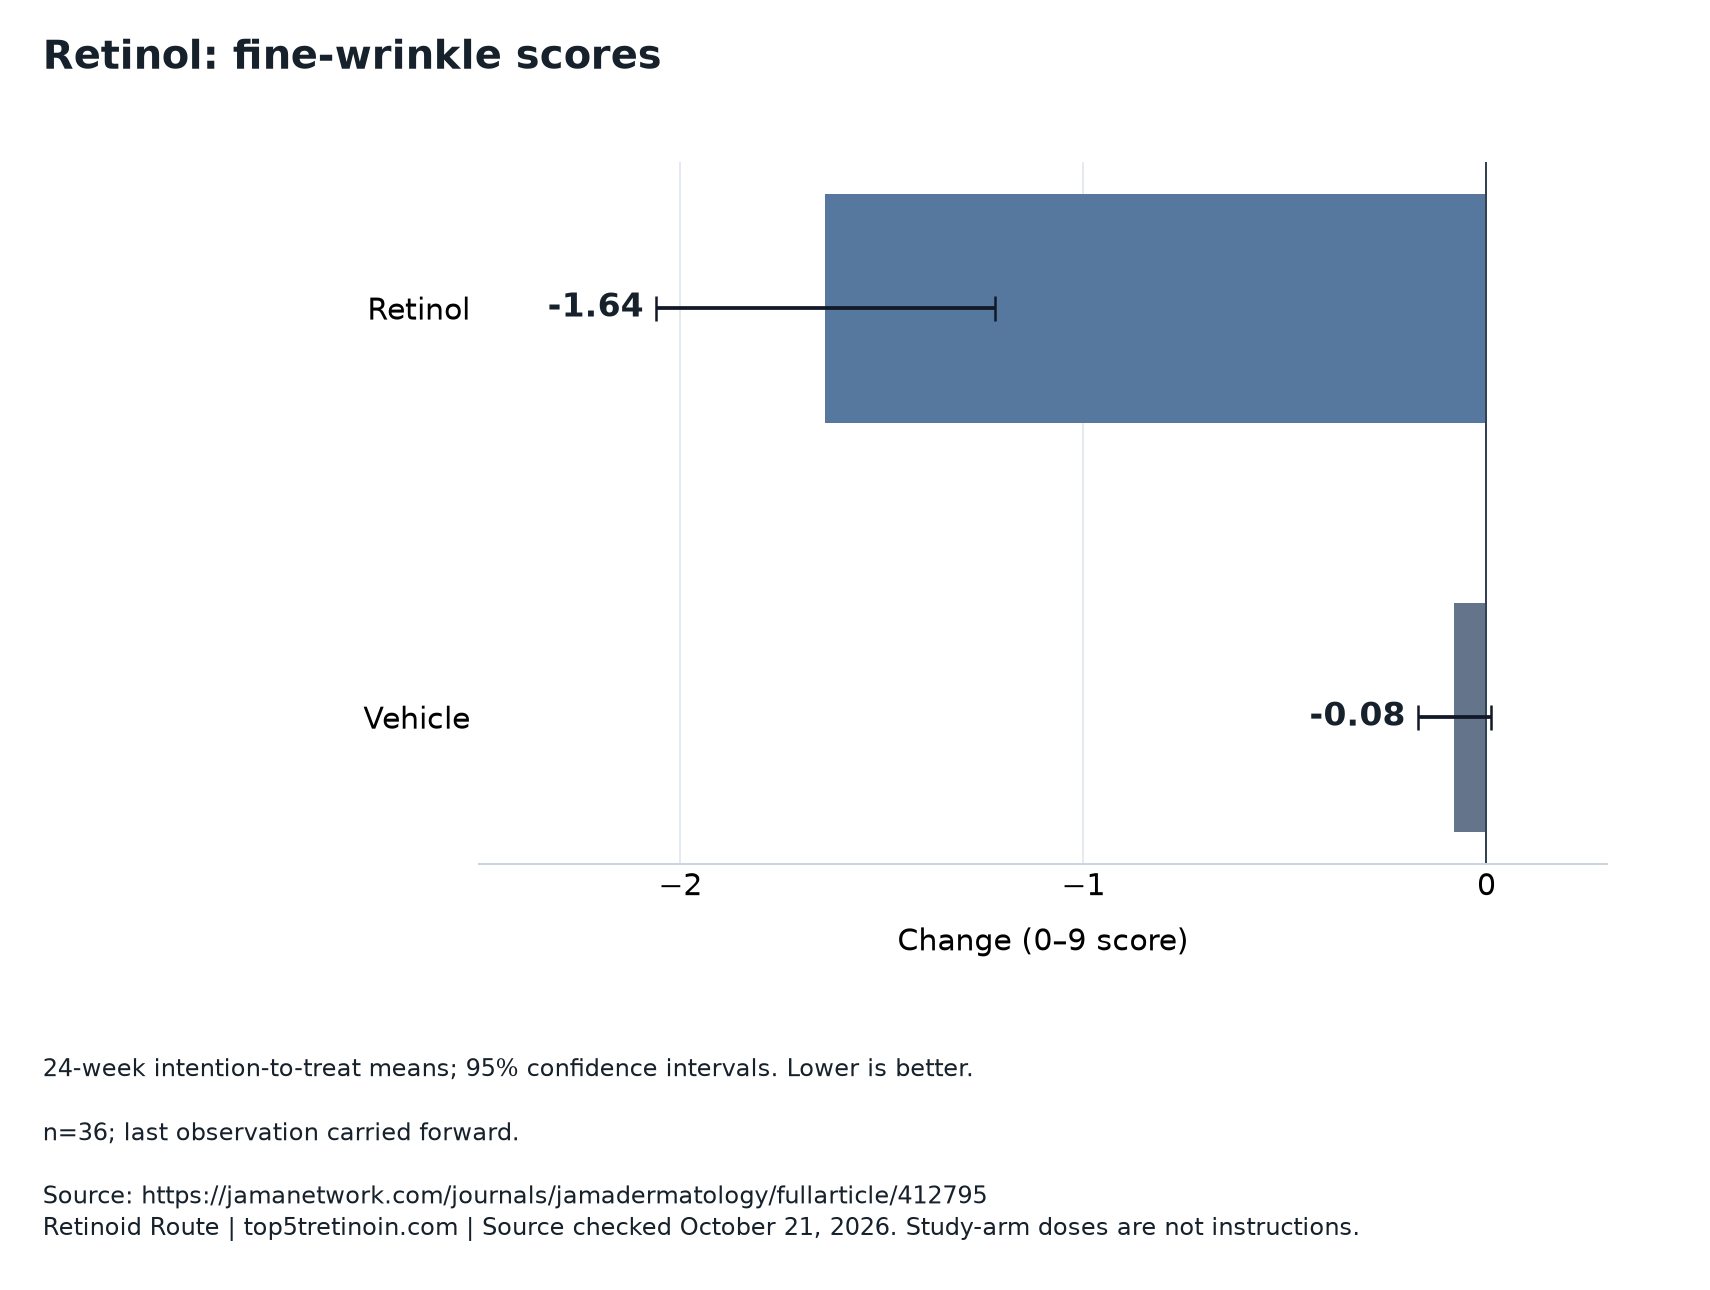
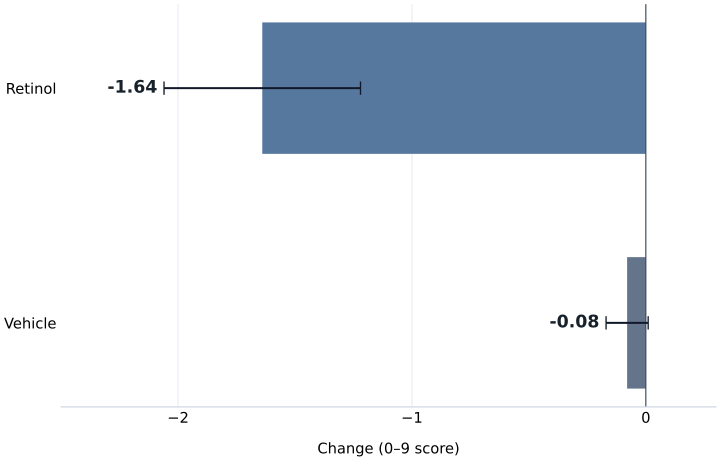
| Retinol | -1.64 | -2.06 to -1.22 |
| Vehicle | -0.08 | -0.17 to 0.01 |
Start with the assigned preparation
The randomized paired-arm study enrolled 36 adults averaging 87. Staff administered laboratory 0.4% retinol or vehicle on protected upper inner arms: up to three weekly applications planned, mean 1.6 delivered, withholding for irritation. Twenty-three completed; 13 withdrew, including three for irritation/pruritus. Analysis carried the last observation forward. Biopsy reporting selected significant results. Four inventors disclosed conditional patent royalties; no separate funding statement was located.
Those facts locate the experiment, but interpreting assignment requires another step. A preparation is one component of a treatment strategy. The strategy also contains rules for delivery, observation and responses to problems. If a rule permits withholding, following that rule is part of implementing the strategy. Calling every omitted application a failure would quietly substitute a different protocol for the one being evaluated.
A useful reading question is therefore: which decision was assigned, and which decisions were made later? Randomization creates a basis for comparing the initial assignments. It does not turn every subsequent difference in experience into a fresh randomized comparison. That distinction remains important even when the treatment and control areas belong to the same person.
Separate opportunities, applications and skin exposure
There are several steps between a proposed schedule and a biological response. An opportunity is a time when treatment could be given. An application is an event that actually occurs. The amount placed on an area adds another measurement. Exposure at the relevant skin tissue is a further concept, requiring an account of what reaches that tissue over time. Replacing this chain with a single word such as use hides which steps were observed.
The table is an editorial measurement framework, not a reconstruction of anyone’s treatment record. It shows why a calendar count cannot, by itself, describe a delivered amount or a tissue concentration. Even a perfectly recorded application count leaves open questions about the amount, area and timing associated with each event. Those details would need definitions before they could support an exposure analysis.
A group average also discards the distribution. The same average can arise from closely clustered experiences or widely differing ones. It does not identify the sequence for any individual. For the separate question of which molecule a product contains, begin with the guide to tretinoin, retinol and retinal; a molecule’s name does not fill in a missing exposure record.
| Measurement | What it records | What remains to establish |
|---|---|---|
| Assigned preparation | Initial allocation | What was subsequently delivered |
| Permitted opportunity | A possible treatment occasion | Whether an application occurred |
| Administered application | A documented event | Amount, area and timing |
| Delivered amount | Material placed on an area | Exposure within the relevant tissue |
| Skin exposure | A defined tissue-level quantity | Its relationship to a measured outcome |
Later use does not inherit randomization
Imagine a study that randomly assigns preparations and then observes delivery. Participants can acquire different treatment histories after assignment. In an illustrative causal sequence, earlier symptoms affect later application decisions, while earlier symptoms also help predict the final outcome. People receiving fewer applications could then differ in a prognostic feature before the next application occurs. Comparing their final results with those of frequent users combines more than the application contrast.
Earlier improvement could also influence later behavior. If people who notice a change become more willing to continue, the apparent direction of the explanation becomes ambiguous: greater use might precede improvement, improvement might precede greater use, or both processes might occur. Recording only total use and a final score cannot distinguish these sequences. Time order is part of the scientific evidence.
These are possible structures, not findings about the participants in this experiment. They explain why an observed-use analysis needs a separate argument about comparability. A reader preparing a clinical conversation can use the irritation questions guide to organize questions about symptoms. That conversation serves an individual’s care; it is not a statistical method for repairing a research comparison.
An invented example with every denominator visible
Consider a fictional population divided into two observed exposure groups. Also divide everyone by a baseline characteristic associated with a favorable or challenging outlook. These categories, people and responses are invented solely to demonstrate arithmetic. They are not trial results, estimates for skin treatment or a claim that these particular subgroups existed in the retinol research.
Within the favorable stratum, the response rate is identical in both exposure groups. Within the challenging stratum, it is again identical. Yet the pooled rates differ substantially because the more-exposure group contains many more people from the favorable stratum. The denominator tells us how much weight each stratum receives. A pooled association can therefore appear without any within-stratum association in this constructed example.
If both exposure groups instead had equal representation of the two strata, their equally weighted response rates would each be 50%. That standardization is another calculation within the invented example, not an adjustment we can apply to the real experiment. The lesson is to inspect composition before attributing a pooled difference to exposure. It does not prove that every observed-use association is confounded, or that stratification always resolves the problem.
| Baseline stratum | More exposure: responses / people | Less exposure: responses / people |
|---|---|---|
| Favorable | 36 / 45 = 80% | 4 / 5 = 80% |
| Challenging | 1 / 5 = 20% | 9 / 45 = 20% |
| Both strata pooled | 37 / 50 = 74% | 13 / 50 = 26% |
Name the strategy the result is meant to compare
A strategy comparison asks what happens under a specified approach to treatment, including its handling of events during follow-up. A fixed-exposure question asks what would happen under a precisely defined exposure pattern. These questions can both matter, but their answers need not coincide. A flexible strategy may permit decisions that a fixed pattern excludes. Before comparing results, write down which events each question allows.
Estimating the fixed-exposure question from observed histories would require more than deleting people whose applications were interrupted. That deletion could select people according to tolerance, prognosis or earlier response. A credible analysis would need accurately timed records, relevant predictors of both delivery and outcome, and defensible assumptions about remaining differences. It would also need enough comparable experiences to support the proposed contrast rather than extrapolating beyond the observations.
The same discipline applies to timing. A final outcome under a strategy does not reveal when its effect first emerged or what would happen after it ended. Our companion guide on endpoints and the treatment timeline develops that separate question. Defining the question first makes it easier to see which observations could answer it and which observations merely sit nearby.
Keep pauses, discontinuation and missing observations distinct
A temporary pause concerns treatment delivery over an interval. Permanent discontinuation concerns whether treatment will resume. Withdrawal from observation concerns participation in measurement. A missing endpoint concerns whether a particular outcome was obtained. These events can overlap, but they are not interchangeable. Someone might stop treatment and still provide a final assessment; someone else might continue treatment but miss the assessment appointment.
This distinction matters when interpreting an analysis population. A count of people with endpoint scores is not automatically a count of uninterrupted users. Similarly, a count of people who received treatment does not establish how many later outcomes were observed. A transparent study flow should connect the events without pretending that one count answers all four questions. Reasons and dates make that flow more informative.
A method that carries an earlier score forward fills an analysis field by assumption. It does not observe a later score, establish intervening exposure or show that the person’s condition remained unchanged. Such a rule can make a calculation possible while leaving uncertainty about the unobserved period. Sensitivity analyses can ask how conclusions vary under alternative assumptions; they cannot convert an assumed value into a measurement that actually occurred.
Read the plotted uncertainty for its own question
The chart compares outcome changes, not randomized frequency groups. An outcome interval describes uncertainty around its particular estimate under the analysis used. It does not become an interval for a different quantity simply because that quantity appears elsewhere in the report. An exposure-response relationship would connect defined exposure differences to outcome differences. A display organized by preparation does not supply that relationship.
Paired measurements introduce another distinction. When two observations come from one person, their errors and responses can be related. The uncertainty of their difference depends on that relationship as well as on the uncertainty of each separate estimate. Subtracting the endpoints of two marginal confidence intervals does not generally produce the correct confidence interval for the paired contrast. The paired observations, or sufficient information about their joint variation, are needed.
A narrow interval would not remove this question mismatch. Precision tells us something about uncertainty in the estimate being calculated; it does not establish that the estimate answers an exposure question. Nor does a statistically detectable difference specify an optimal amount of treatment. Identifying an optimum would require an explicit objective, relevant competing outcomes and evidence across the candidate strategies being compared.
Use neighboring studies to check what is being compared
The indexed 48-week tretinoin abstract reports 99 completers comparing 0.1%, 0.025% and vehicle. Active concentrations had similar observed facial improvement; erythema/scaling were greater with the higher concentration. Initial enrollment and allocation methods are unreported there; funding is unestablished. Similar findings do not establish equivalence.
The separate two-year 0.05% emollient-cream abstract reports 204 treated subjects and greater facial improvement than vehicle, without usable effect magnitudes. Publisher disclosures document OrthoNeutrogena support and employment, equity, research or consulting relationships. This reading covers the abstract and disclosures, not the full methods and results.
These comparisons illustrate why nominal strength, treatment duration and actual exposure must occupy different columns in an evidence review. Changing the preparation changes the intervention being compared; extending observation changes the time window. Neither move isolates the effect of receiving another application. A comparison of frequencies would need to define that contrast directly, including what remains constant.
The same reasoning prevents a longer follow-up period from automatically implying a larger delivered amount. Elapsed time is a calendar property; delivery is an observed treatment history. Our cream, gel and lotion comparison provides a separate place to examine formulation categories. It should not be read as a conversion formula between study concentrations or schedules.
Build the measurement record before the statistical model
Suppose researchers wanted to study exposure more directly. A useful record would begin before each delivery decision: current symptoms, previous applications, relevant earlier outcomes and the reason for the next decision. The application record would then specify what occurred. Later outcomes would have their own assessment dates. This sequence would let an analyst distinguish information available before a decision from information arising afterward.
Definitions would need to be consistent across participants. Does an application mean an attempted administration or a completed one? Is the relevant exposure recent, cumulative or time since the previous event? Different definitions can produce different scientific questions. Choosing whichever definition yields the most attractive result after seeing the data would weaken confidence in the interpretation. A prespecified question makes the analysis easier to scrutinize.
A statistical model then needs assumptions connecting those records to a causal conclusion. Measurement error, unrecorded influences and a lack of comparable histories can remain problems even in a large dataset. Adding variables to an equation does not guarantee a fair comparison. When evaluating a different preparation, the approved-product and compounded-product guide offers a separate documentation question; product identity and causal analysis both need their own evidence.
Keep research schedules separate from current care
Current RENOVA labeling concerns tretinoin cream 0.02% as an adjunct for fine facial wrinkles with comprehensive skin care and sun avoidance. Its evidence limits beyond 52 weeks and above age 71 belong to that formulation. They do not become universal limits for every retinoid, nor does another formulation’s study remove them.
For a reader, the practical interpretation is to separate an evidence question from a care question. Asking what a study compared is different from deciding how an individual should use a product. The online consultation guide can help organize that discussion. An average, a maximum permitted frequency and a confidence interval are not substitutes for an individualized assessment and the relevant product information.
There is also a documentation question when reviewing a service. As editorial interpretation, the CoreAge Rx review and Dermatica review are places to check the recorded offer and terms. Linking those records does not connect either service to the experimental preparation or its outcomes. Keep the research comparison, the product identity and the service agreement separate when deciding what each document establishes.
Questions about the evidence
Can the reported average be treated as the best application frequency?
No. A descriptive average summarizes what occurred across observations. An optimum requires comparing defined alternatives against an explicit objective, including relevant harms and benefits. Even if an average coincides with a workable schedule for someone, that coincidence would not establish why it is appropriate or whether another schedule would be better. The statistical summary cannot make that clinical decision.
Does a permitted pause mean a participant failed to follow the study?
A pause can be consistent with a protocol that includes rules for withholding treatment. Adherence should be evaluated against the actual instructions, including those rules, rather than against an imagined requirement for uninterrupted delivery. This is a definition for interpreting research conduct, not an instruction to create a personal pause or restart schedule.
Why not calculate adherence by dividing an average by the maximum?
That division assumes the maximum was the required denominator for every person and every relevant period. It also ignores whether rules changed the permitted opportunities. The resulting number could be mathematically correct yet mislabeled. A defensible adherence measure needs a defined numerator, an applicable denominator and a clear rule for permitted changes before anyone performs the calculation.
Would analyzing only uninterrupted users solve the exposure question?
It could create a selected comparison instead. Remaining uninterrupted may be related to characteristics or earlier experiences that also predict the outcome. Removing everyone else changes who is being compared. The analysis would need to explain why the retained groups are comparable for the causal question, not merely demonstrate that their application records look simpler.
What does the fictional stratification example establish?
It establishes an arithmetic possibility: different mixtures of baseline strata can produce different pooled response rates despite identical rates within each stratum. It does not diagnose the real study, identify a hidden variable or prove that exposure has no effect. Its purpose is to make the denominator and group composition visible before interpreting an association.
Editorial assessment
The most useful reading habit is to write the comparison in a complete sentence: which preparation or strategy, in which population, with which delivery rules, and for which observed outcome? Then write the exposure question separately. If answering the second requires information the first sentence does not contain, the original comparison has not automatically answered it. A good analysis can preserve the value of a treatment comparison while recognizing that a fixed-frequency or uninterrupted-use claim needs additional evidence. This keeps the scientific question precise without blaming participants for protocol-consistent decisions or turning a group summary into personal instructions.
Research access and limitations
This is an educational interpretation of research design and the explicitly identified accessible records. The numerical stratification example is invented. General methodological explanations are editorial analysis, not additional trial findings or a prescribing plan.